Deen's Daily
Deen’s Daily: Targeting Chinakhov; Joshua Finds New Home; Habs Might Trade a Franchise Great
Should the Avs target a disgruntled forward in Columbus? Also, the Leafs added a big winger to their lineup and the Habs are contemplating trading… Carey Price?
All that and more on this edition of Deen’s Daily — July 17.
Colorado Hockey Now
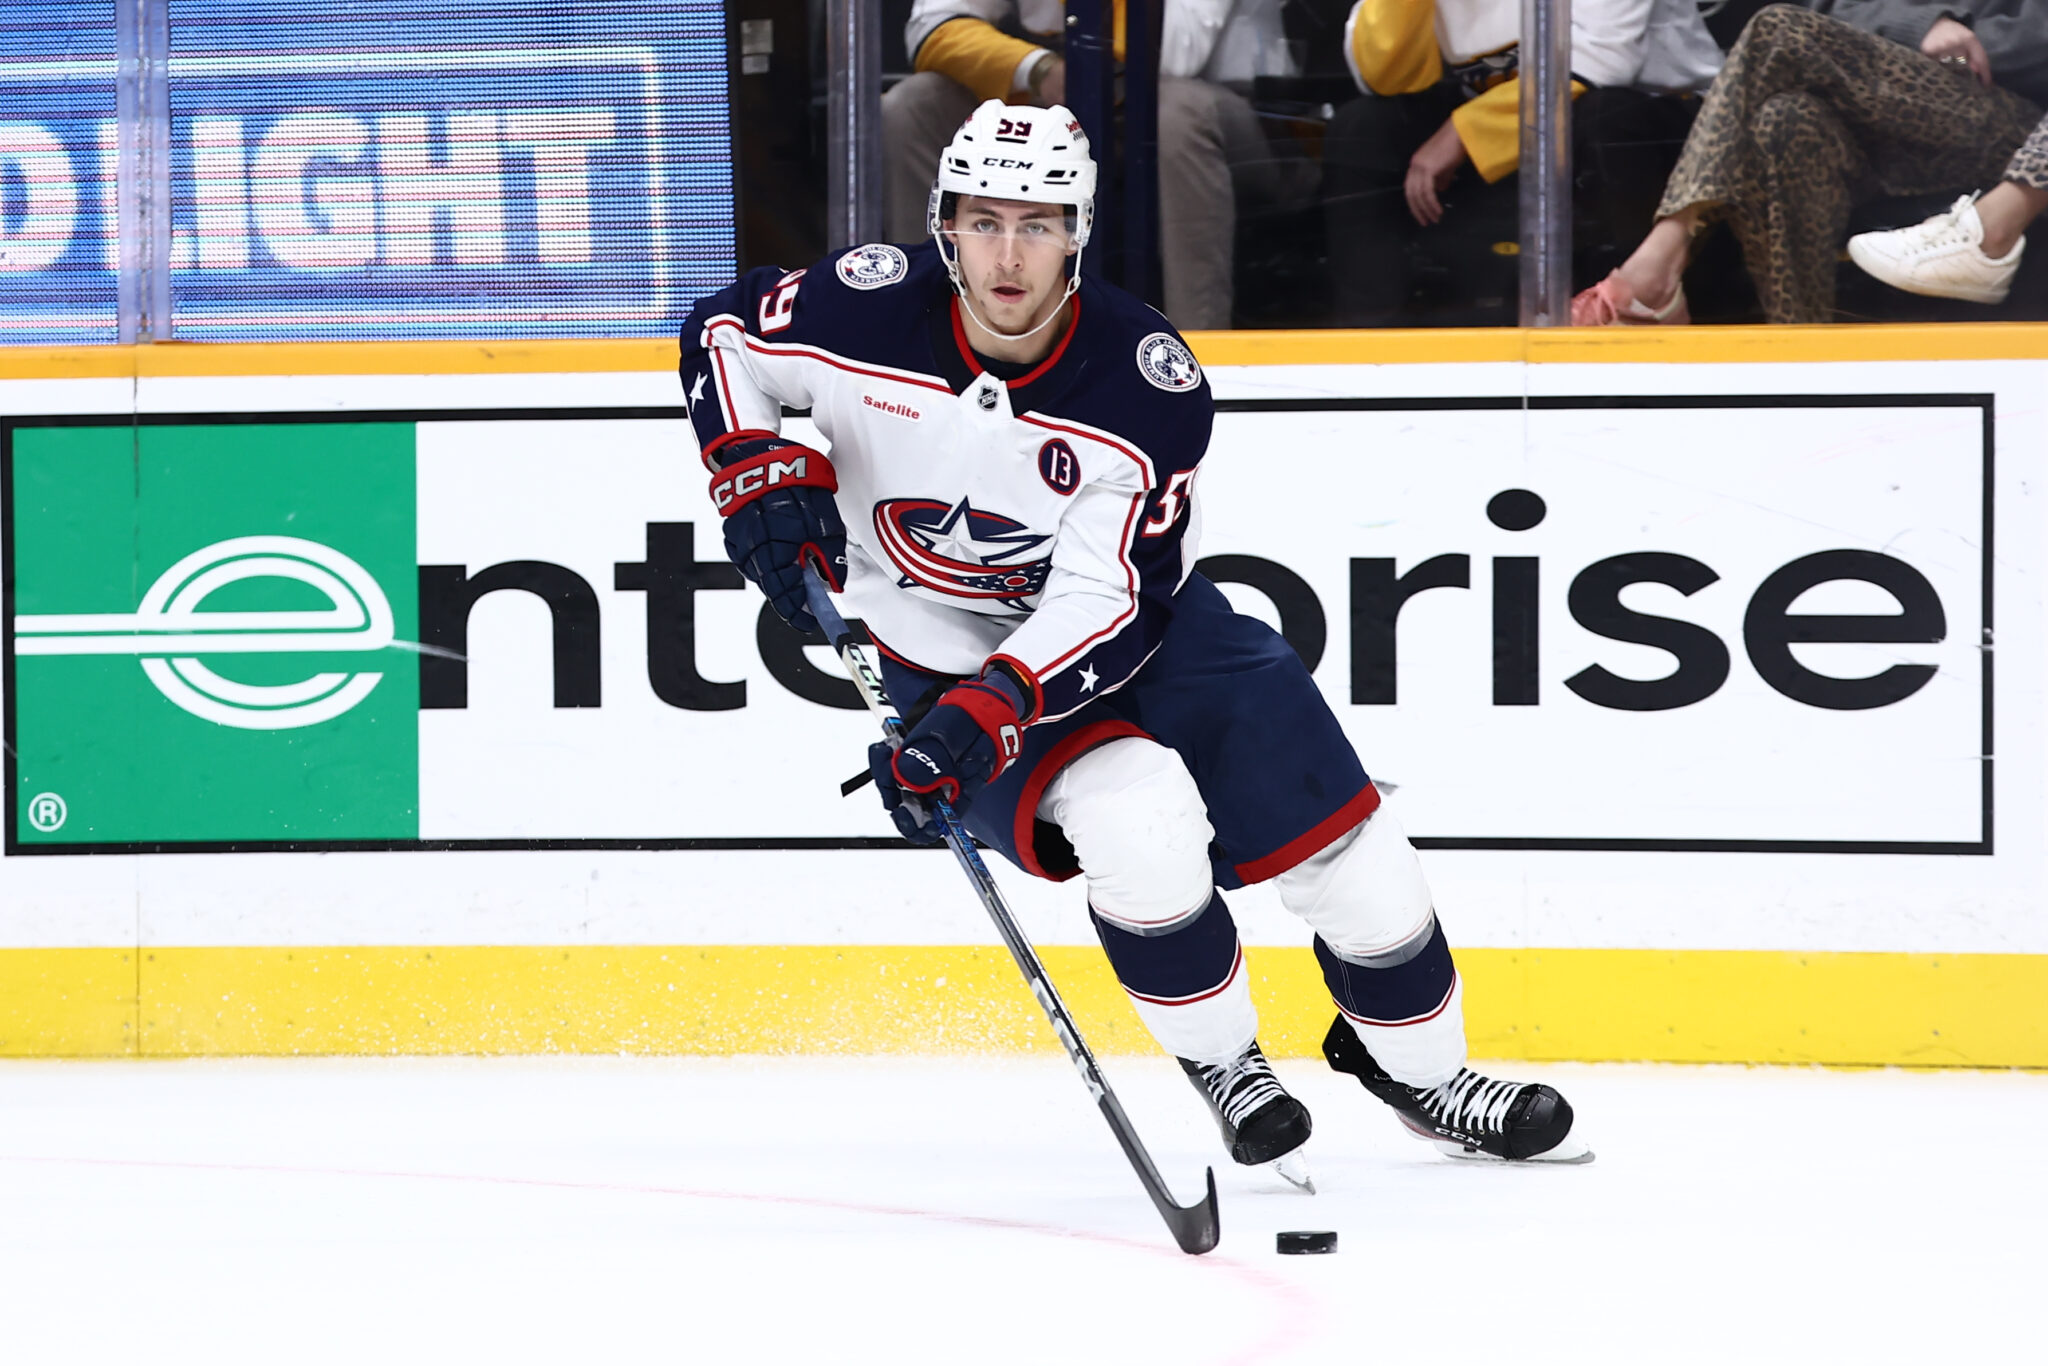
We found out early Thursday morning from Aaron Portzline of The Athletic that Yegor Chinakhov wants out of Columbus. Well, Portzline elaborated on the trade request and got a quote from Jackets GM Don Waddell after Chinakhov’s agent went public on social media.
This is a buy low candidate that I think the Avs should explore. Click below to read my thoughts on the matter.
Also, the Avs released their schedule on Wednesday. Today, I looked at some key dates and patterns in their upcoming season. Click below for more.
Read More: Breaking Down the Avalanche’s 2025-26 Schedule
Around The NHL
Dakota Joshua Dealt: The Toronto Maple Leafs made a deal for Dakota Joshua on Thursday, acquiring him from the Vancouver Canucks for a fourth-round draft pick. Joshua is a big body and places a physical game. He was drafted by the Leafs in 2014 but never dressed for them.
After dealing with some personal issues and a tough year in Vancouver, he gets a change of scenery and a chance to play a big role with a talented Leafs roster. I like this move, and gamble, by Brad Treliving. Even if it comes with a $3.25 million price tag.
Montreal Hockey Now: The Habs are probably going to trade Carey Price after his bonus is paid out on Sept. 1. Here are the teams that could make sense in the cap-clearing move.
New Jersey Hockey Now: After the extension signed by Jake Allen, and Jacob Markstrom still the starter, the Devils have a decision to make with Nico Daws. What should they do?
Pittsburgh Hockey Now: The Pens have two valuable wingers in Bryan Rust and Rickard Rakell that could be moved in the coming months. What are their values on the market?
Florida Hockey Now: The Panthers again lost out on the ESPY Award for the best team of the year. It’s the second time in a row they were nominated but came up short.
Speaking of which, Gabe Landeskog was also up for Best Comeback Story but did not win. Which was the wrong decision in my books.