
Deen's Daily
Deen’s Daily: Potential Kadri Destinations; Ekblad Talks Contract Extension; Mueller’s Retirement
The Avs were listed as a potential destination to acquire one of their old fan favorites by a Sportsnet writer. Also, a retirement was announced, the World Junior Summer Showcase began, and Aaron Ekblad spoke publicly about his bargain contract extension.
All that and more on this edition of Deen’s Daily — July 28.
Colorado Hockey Now
As I wrote about in yesterday’s Daily, Nazem Kadri has 11 months remaining before his no-move clause switches to a 13-team no trade. Basically, the clock is ticking on him having 100% contract of his next destination.
Ryan Dixon at Sportsnet wrote about five destinations that could make sense for Kadri, and he listed the Avalanche as one of those teams. Yes, even after Colorado acquired and signed Brock Nelson over the past few months.
READ MORE: One Sportsnet Writer Believes Avalanche Should Still Target Kadri
Remember Peter Mueller?
Aside from Marek Svatos, I don’t think any under-the-radar player caught my eye quicker than Mueller. His 15-game run after the 2010 trade deadline was one of my favorite Avalanche stories of that era.
Now 37 years old, Mueller officially announced his retirement from hockey. I was surprised to see all the places he’s played for since departing from the NHL more than a decade ago.
READ MORE: Former Avalanche Forward Retires from Professional Hockey
Around The NHL
Detroit Hockey Now: One of the Wings’ Swedish prospects is taking the Henrik Zetterberg route and suiting up for Timra of the Swedish Hockey League.
Pittsburgh Hockey Now: The week-long World Junior Summer Showcase began on Friday at Ridder Arena in Minnesota. The Pens, as you’d expect from a rebuilding team, have a ton of representation at the event. The Avs don’t have anyone there, which isn’t a surprise given the number of picks and prospects they’ve dealt in recent years. Their 2024 draft pick Will Zellers is listed for Team USA, albeit the Avalanche traded him to Boston in the Casey Mittelstadt and Charlie Coyle trade.
The WJSS is one of my favorite events to cover. They’re often held at the USA Hockey Arena in Plymouth, Mich., about 15 minutes from where I grew up. I try to go back for it whenever it’s there.
Back in 2017 and 2019, I watched guys like Cale Makar, Conor Timmins, and Sampo Ranta at that event. It’s truly a fun hockey get-together with several GMs, scouts, and NHL legends present.
Philly Hockey Now: Ready for bold predictions season? We’ve got three on the Flyers over at PhHN.
New Jersey Hockey Now: That Sportsnet story, which listed five Kadri destinations, also has New Jersey among them. The Flames and Devils have already made one big trade last year, involving Jacob Markstrom.
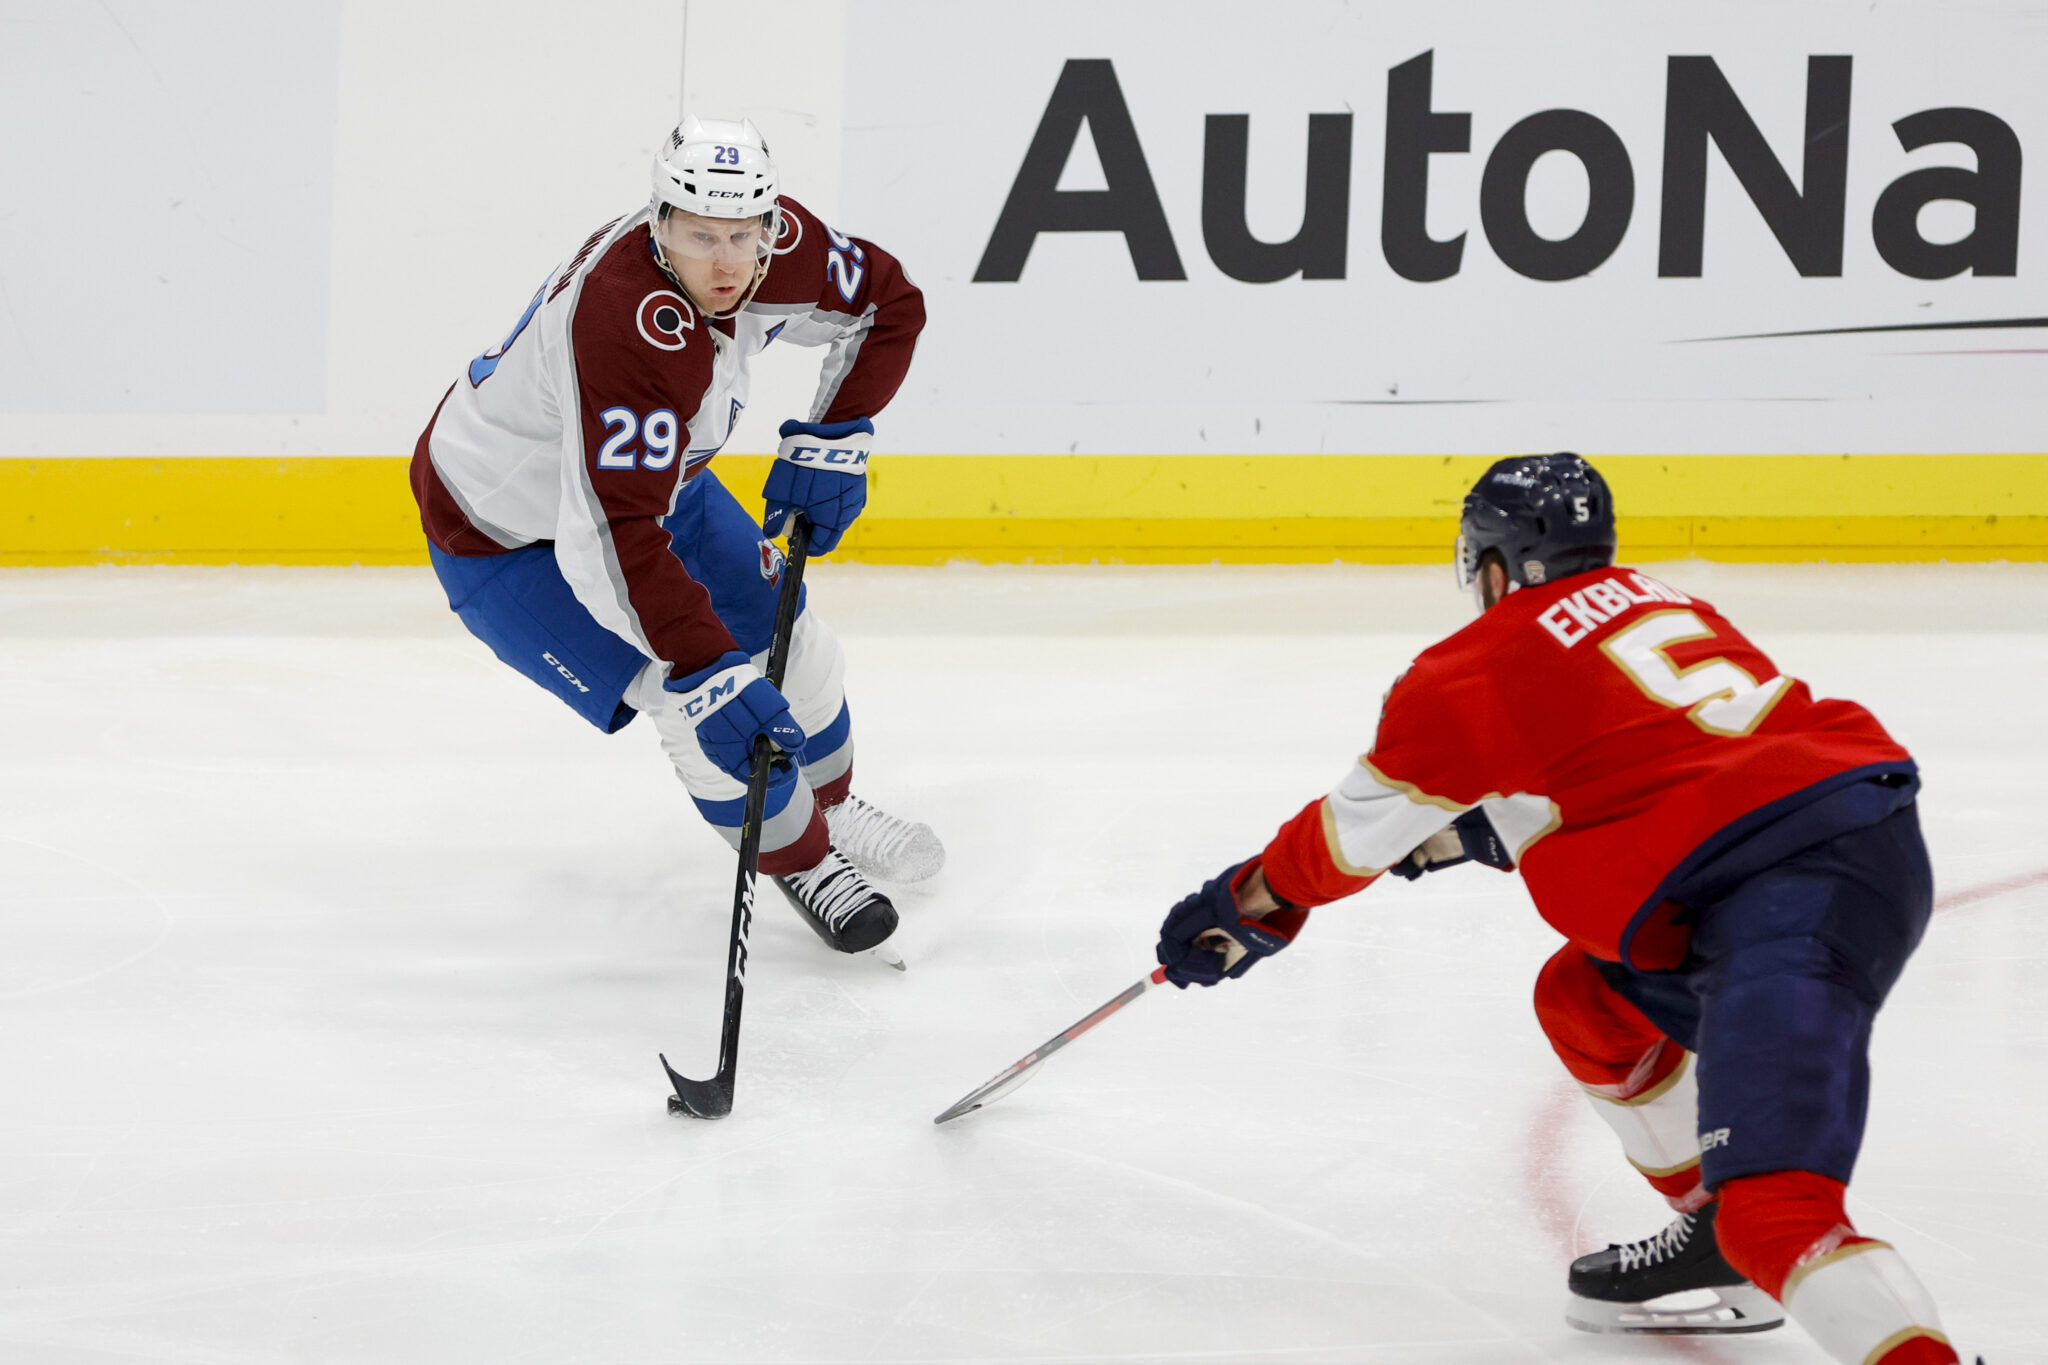
Florida Hockey Now: Aaron Ekblad said recently that Florida was always his only option. Which, isn’t a surprise for a player that won the Stanley Cup again, was playing his best hockey of his career, and decided to take a pay cut.
We often see players take less than market value to stay with their clubs, but those deals are usually still reasonable. Ekblad signing for $6.1 million was the first time I’ve seen an extension that genuinely should’ve angered the NHLPA. You always want players signing within the range of their value to raise all future contracts.
Take Nathan MacKinnon for example. Signing for $12.6 million is far less than what he should’ve taken, but it was still the highest paid contract at the time and a reasonable extension. Could you imagine if MacKinnon signed for $9-$10 million? That would’ve been an issue for other star players.
Ottawa Hockey Now: Predicting Shane Pinto’s next contract.